Research
Bennu
My research at Bennu focuses on characterizing the asteroid’s surface geology, identifying mass movement patterns, and analyzing boulders to better understand Bennu’s parent body. Through participating on the OSIRIS-REx mission I have led and participated in research about a wide variety of topics about Bennu, including analyses of Bennu’s boulders, craters, terraces, shape, geophysical environment, color, and thermal properties. As a member of the OSIRIS-REx science team I helped to identify and characterize the sample site before, during, and after sample collection. See below for a few of my research highlights, and for full list of publications see my CV page.
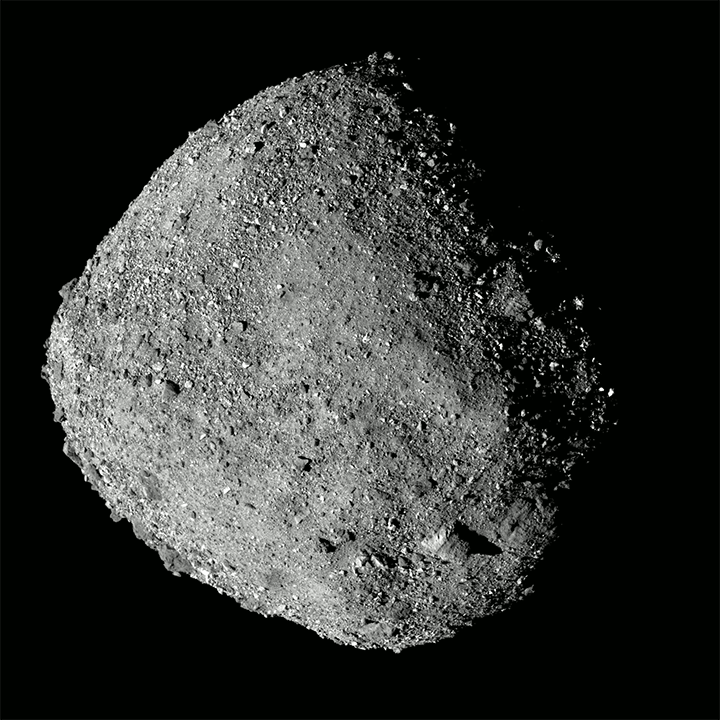
Asteroid Bennu, data collected by the OSIRIS-REx spacecraft. Credit: NASA/Goddard/University of Arizona
Bennu’s diverse boulders and heterogeneous parent body
If there’s one thing Bennu has an abundance of, it’s boulders. From the early images of Bennu’s surface it was clear that boulders had different surface textures, and further investigations with other instruments revealed there are at least two “flavors” of boulders on Bennu that vary in brightness, texture, and thermophysical properties. I led an analysis of several hundred boulders in the region around the Nightingale sample site that characterized boulder albedo (brightness), morphology (surface texture), and surface roughness. Based on the variations in these properties, we proposed a classification dividing boulders into four groups, which we named Type A, B, C, and D (see the figure below). This classification was generated through a combination of manual examination and unsupervised clustering algorithms (a form of machine learning), and we adapted qualitative research methods from the social sciences for our morphologic analysis so that these data could be included in our clustering algorithms. For more details on our specific methodology, see the full paper linked below.

The four morphologic boulder types on asteroid Bennu. Boulders range in texture, brightness, and surface roughness, and have previously been found to vary in thermophysical and spectral properties. This diversity indicates Bennu formed from a heterogeneous parent body that was fragmented from a huge impact, and shards of that parent body are the boulders we see currently on Bennu. From Jawin et al. (2023).
Since Bennu is a rubble pile asteroid, the boulders are fragments of its parent body—so the fact that we see diverse boulders on Bennu is evidence that the parent body was likely heterogeneous. Contacts we documented between the four boulder types indicate that these all probably came from the same parent body (as opposed to multiple distinct parent bodies). And the physical and chemical properties of the different boulder groups indicate that different geologic processes may have been at work at different locations on and in the parent body: the rugged, layered, clastic texture of Type A boulders suggests these rocks were affected by impacts, so these probably formed at or near the surface of the parent body. In comparison, the Type C and D boulders are less porous, lack any resolved clastic or layered texture, and contain evidence of carbonate minerals that formed from aqueous alteration. So these boulders may have formed in the deeper interior region of the parent body in a region of enhanced aqueous alteration, and beneath the zone of intense impact brecciation near the surface.
In this paper we also analyzed the Nightingale sample site and images taken during and after sample collection, and applied our classification system to particles that were probably collected by the OSIRIS-REx spacecraft. Our analysis found evidence for morphologic diversity within the returned sample that should represent the diversity seen within the boulders on Bennu, so the sample should provide a robust glimpse into Bennu’s parent body. And the coolest part: our predictions in this paper are being actively tested by the OSIRIS-REx sample analysis team, so stay tuned for updates!
Read more about this analysis in the full 2023 paper.
Co-authors on this work: Ronald-L. Ballouz, Andrew J. Ryan, Hannah H. Kaplan, Timothy J. McCoy, Manar M. Al Asad, Jamie L. Molaro, Benjamin Rozitis, and Lindsay P. Keller
Establishing Bennu’s global geology
Assessing the global geology of Bennu was no easy task, since it is a rubble pile asteroid which—as the name suggests—has an incredibly rugged, weak, boulder-strewn surface. For this project, I led a team of researchers who developed the techniques necessary to identify and characterize geologic units on this type of planetary body. Rubble pile asteroids may be the most common type of rocky body in the Solar System by number. So as we continue to study asteroids for science, exploration, and planetary defense, the techniques we developed can be applied to understand the geologic histories of these rubble piles.
Our geologic assessment revealed two units on Bennu distinguishable by subtle changes in surface roughness and boulder distribution. We established, through analyses of morphology, stratigraphy, and crater size-frequency distributions, that the Rugged Unit (blue region in the figure below) is younger than the Smooth Unit (orange region below), and experienced resurfacing within the past ~500,000 years. Much of Bennu’s surface geology formed since the asteroid transitioned to near-Earth space 1.75 million years ago, including its mass movement features, small craters, the distribution of large boulders, several lineaments and terraces, and much of the Rugged Unit. Several larger geologic features, however, are preserved from Bennu’s earlier history in the Main Asteroid Belt over 10 million years ago, including the formation of the largest craters, the equatorial bulge, the Smooth Unit, and the longitudinal high-standing and low-lying regions.
There’s tons more information in the full 2022 paper, which you can read here.
Co-authors on this work: Tim J. McCoy, Kevin J. Walsh, Harold C. Connolly, Ronald-L. Ballouz, Andrew J. Ryan, Hannah H. Kaplan, Maurizio Pajola, Vicky E Hamilton, Olivier S. Barnouin, Josh P. Emery, Ben Rozitis, Daniella N. DellaGiustina, Mike G. Daly, Carina A. Bennett, Dathon R. Golish, Mark E. Perry, R. Terik Daly, E. Beau Bierhaus, Michael C. Nolan, Heather L. Enos, and Dante S. Lauretta

Global geologic map of asteroid (101955) Bennu. From Jawin et al. (2022).
Mass movement on Bennu
We found evidence of mass movement, or rock fragments moving across the surface, at virtually all locations on the surface of the asteroid. The mass movement we found appears to be moving in the current downslope direction—this might seem obvious, but on small rubble pile asteroids like Bennu, the direction of local downslope can actually change over time as the asteroid spins more quickly (or more slowly). Since we observed that mass movement is following the current slopes, we determined the movement occurred in the relatively recent past (probably the last few hundred thousand years).
Check out the full version of the 2020 paper here. Also check out a profile of this research by Smithsonian Voices!
Co-authors on this work: Kevin J. Walsh, Olivier S. Barnouin, Tim J. McCoy, Ron L. Ballouz, Daniella N. DellaGiustina, Harold C. Connolly Jr., John Marshall, Chloe Beddingfield, Michael C. Nolan, Jamie L. Molaro, Carina A. Bennett, Daniel J. Scheeres, Michael G. Daly, Manar Al Asad, Terik Daly, Beau Bierhaus, Hannah C.M. Susorney, Hannah H. Kaplan, Heather L. Enos, Dante S. Lauretta

Map of mass movement features. Arrows are color-coded to different mass movement morphologies, and point in the apparent direction of movement. From Jawin et al. (2020).
OSIRIS-REx Sample Collection and Sample Site Assessment
NASA's Origins, Spectral Interpretation, Resource Identification, Security, Regolith Explorer (OSIRIS-REx) mission has been studying the carbonaceous asteroid (101955) Bennu, and will return a sample to Earth on September 24, 2023! As a member of the Regolith Development Working Group, I helped to assess the “sampleability” of Bennu by determining which locations provide the best opportunity for sample collection. Although Bennu was much rougher than we anticipated, we successfully identified a sample site which we named Nightingale, inside Hokioi crater in near the north pole.
To provide geologic context for the returned sample, I led the geomorphic assessment of the Nightingale sample site and surrounding region, which is summarized in Barnouin et al. (2022), PSJ 3, 75. From this analysis, we predict the returned sample will contain material that was recently exposed from the Hokioi crater impact, as well as potentially older particles that became trapped in the crater interior while migrating towards the equator due to steep regional slopes; we also predict the sample will contain a range of brightness and composition, in addition to exposure age, and that the sample will have low cohesion.
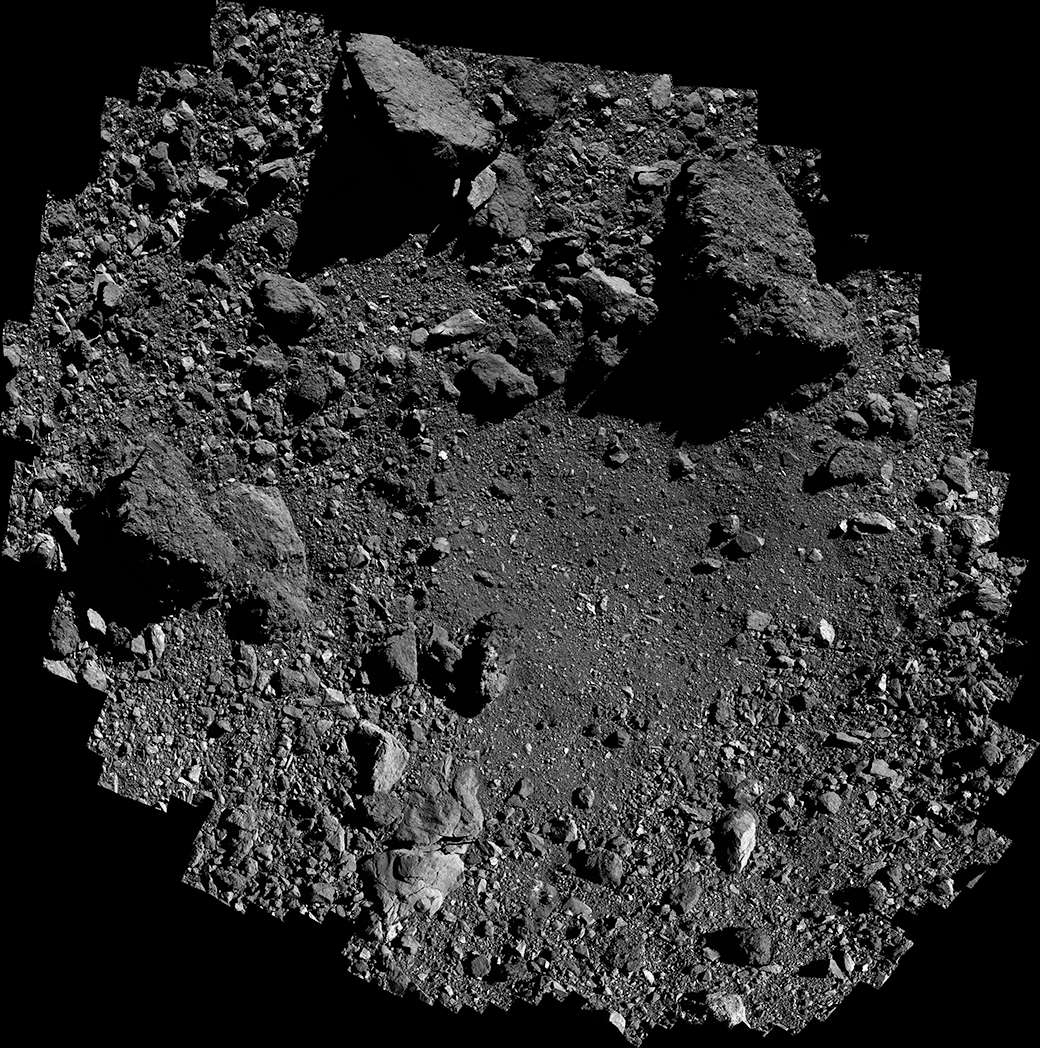
Mosaic of images over the Nightingale sample site, inside Hokioi crater. North is to the left of the image. Image credit: NASA/Goddard/University of Arizona

Sketch map of the Nightingale region surrounding Hokioi crater, from Barnouin et al. (2022).
Sample collection occurred on October 20, 2020 and was a success! As part of the post-TAG analysis, I investigated how the spacecraft interacted with the surface before the gas canisters fired (see gif below), which is summarized in Walsh et al. (2022), Science Advances 8, 27. Based on shadows cast on the lip of the TAGSAM and the zone of deformation around the contact region, we concluded that the TAGSAM head penetrated into the surface 2-3 cm and deformed the surface over an area ~6 times larger than the contact region. These results and additional assessment of the spacecraft accelerations during contact allowed us to determine that Bennu’s surface has near-zero cohesion and is half as dense as the bulk asteroid. Trying to stand on the surface of Bennu would therefore be like trying to stand on the surface of a ball pit!
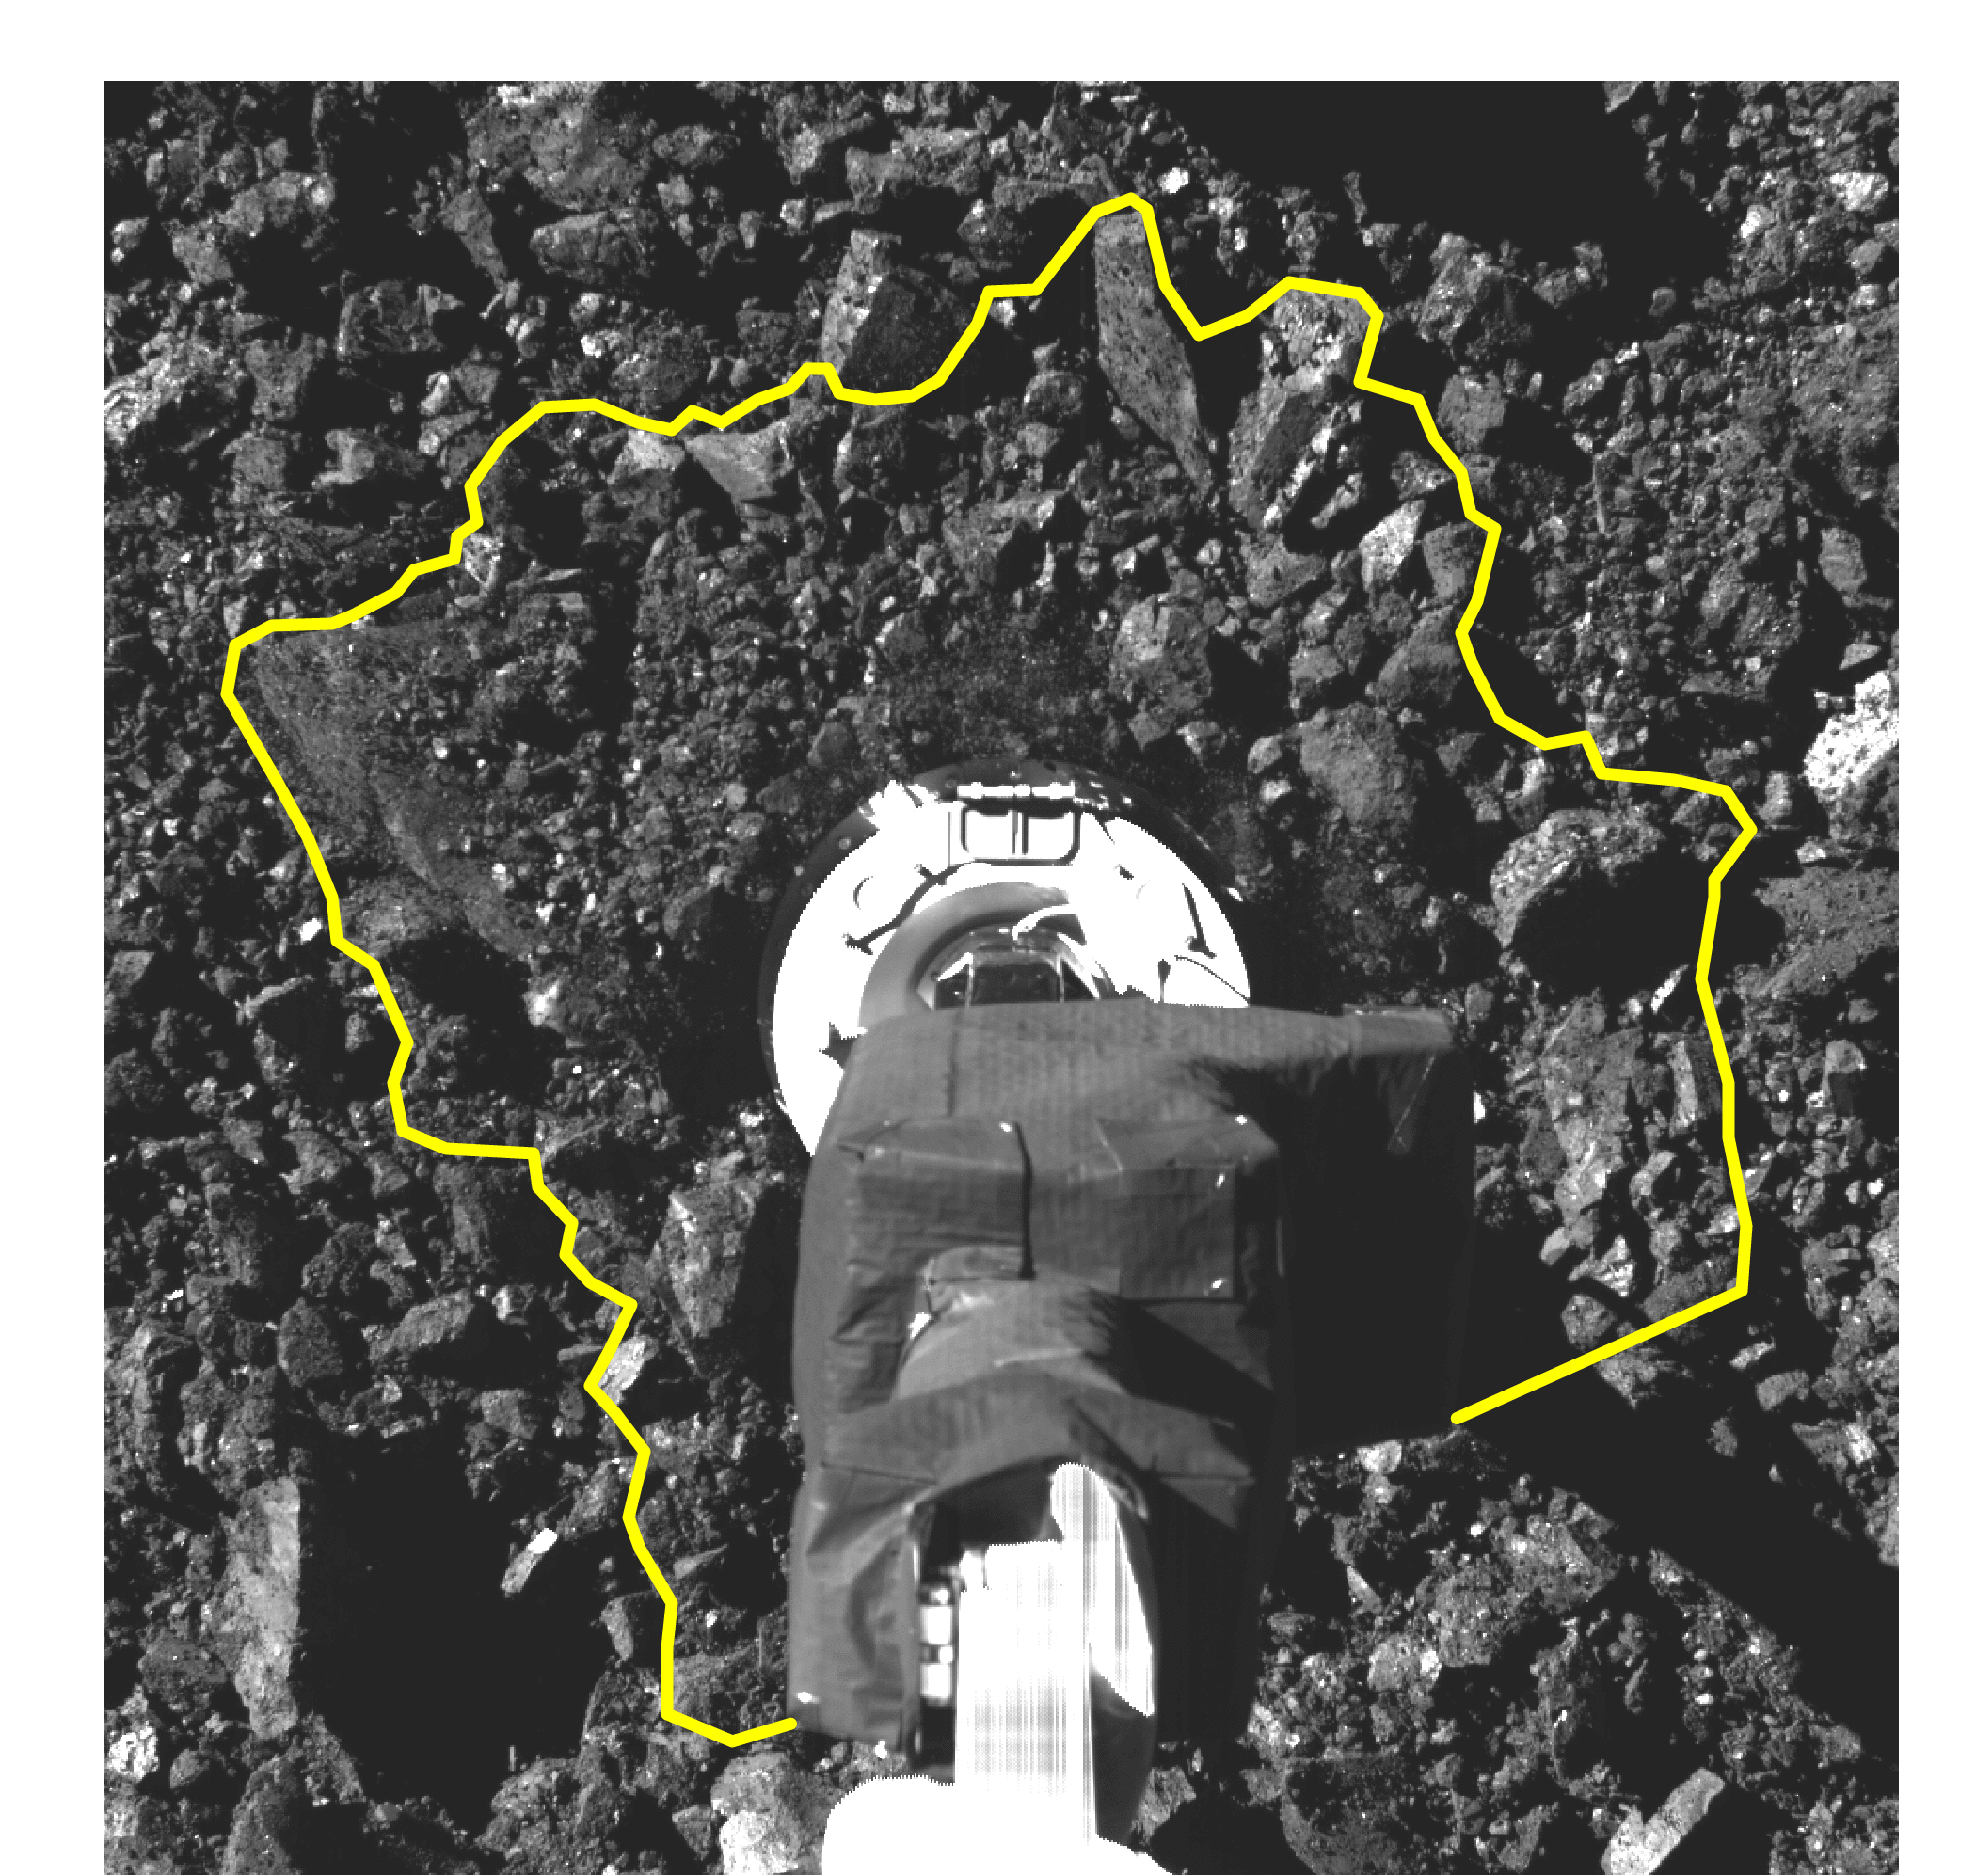
Images taken immediately before and after the spacecraft first contacted the surface of Bennu. Image credit: NASA/Goddard/University of Arizona
Mars
My martian research focuses on how the surface responds to variations in climate during the Late Amazonian, the most recent period of its history. My current research uses radar sounder data from the SHARAD instrument onboard the Mars Reconnaissance Orbiter to study closely-spaced reflectors in the polar layered deposits. These layers of ice and dust correspond to variations in the climate which led to changes in precipitation, wind patterns, and dust loading over time. I have also studied mid-latitude glaciation in crater interiors, and how a changing climate causes deglaciation which led to extensive environmental change across the planet.
Laterally expansive, closely-spaced dust layers in the North Polar Cap
I used SHARAD radar data to study the North Polar Layered Deposits (NPLD) to study one reflector that appeared anomalously bright relative to other nearby reflectors. This reflector can be traced across over 400 km and shows similar behavior across this entire region. Using radar data that were processed to split the SHARAD signal into multiple “sub-bands” at different frequencies, we found that the bright reflector changed in reflectivity in two sub-bands—this behavior indicates that the SHARAD signal is experiencing interference from this reflector, which would artificially brighten the echo strength. Such interference would arise from two (or more) closely-spaced dielectric interfaces within ~20 m vertical resolution cell of the SHARAD multiband data. We measured the variation in brightness of this reflector and performed multi-layer resonant echo modeling to investigate the physical configuration of layers that could lead to similar brightness variations. It is not possible to uniquely determine the physical configuration, but we demonstrated that this reflector could represent two layers of packed dust a few tens of cm thick separated by 0.5 to 3 m of ice. Regardless of the specific physical configuration, the depositional environment required to form this reflector must have experienced fairly uniform precipitation rates and/or sublimation lag development rates over the observed ~400 km deposition zone. Likewise, there must have been minimal postdepositional aeolian activity, since the interference behavior extends across such a large region. The climatic setting over the North Pole of Mars at the time of deposition therefore would have been distinct from the current environment, which experiences intense and persistent katabatic winds.
Check out the full version of the 2022 paper here.
Co-authors on this work: Bruce A. Campbell, Jennifer L. Whitten, Gareth A. Morgan

Extent of the bright reflector in the martian North Polar Layered Deposit, showing the location of analyzed SHARAD tracks used to identify the reflector. The reflector is boxed in the radargrams in both sub-bands, H and L, and the full bandwidth data. From Jawin et al. (2022).
Martian deglaciation as an indicator of climatic variability
Mars contains abundant evidence of glaciation at virtually all latitudes, but the highest concentration of glacial features are present in the mid-latitudes (~30-60°). Inside many glaciated craters, we identified a group of young geologic features that indicate deglaciation and subsequent modification. Wee argued this subsequent modification occurred during a paraglacial period (a transient period on Earth immediately postdating glaciation where rapid erosion occurs). Through assessing the characteristics and relative ages of these paraglacial features compared to remnant glacial deposits within the craters, it is possible to better constrain global climate cycles on Mars.
Check out the full version of the 2018 paper here.
Co-authors on this work: James W. Head and David R. Marchant

(Left) Glaciated crater on Mars that contains evidence of paraglacial modification. Glaciation is evident from the presence of concentric crater fill (CCF), while the stratigraphically younger features are evidence of paraglacial modification.
(Right) Sketch map of the paraglacial features in the glaciated crater to the left. From Jawin et al. (2018).

Global patterns of deglaciation on Mars
Evidence of paraglacial activity is present across the mid-latitudes of Mars, but the distribution and association of paraglacial features is not uniform (as can be seen in the figure above). The distribution of paraglacial features appears to be dependent on local geologic setting as well as regional accumulation and ablation patterns.
Check out the full version of the 2021 publication in Icarus. Co-author on this work: James W. Head
Recently glaciated terrains on Mars represent important human exploration destinations as they contain abundant deposits of near-surface ice. This ice could be extracted and utilized by humans, cutting down on consumable resources transported from Earth. The wide distribution of glaciated terrains at a variety of latitudes on Mars provide abundant exploration targets.

Global distribution of paraglacial features in glaciated crater interiors. From Jawin et al. (2021).
Moon
Characterizing endmember volcanism on the Moon

(Left) Apollo 15 Mapping Camera image (A15-M-2610) of the Aristarchus plateau. Note the large, fresh Aristarchus crater, as well as the sinuous rille Vallis Schroteri. The entire uplifted, hummocky plateau has been mantled by pyroclastic materials.
(Right) Topography of the Cobra Head region of the plateau. All of the major volcanic features on the plateau (Cobra Head, Vallis Schroteri, the pyroclastic deposit, and the irregular cones) may have been formed from an eruptive vent located at Cobra Head.
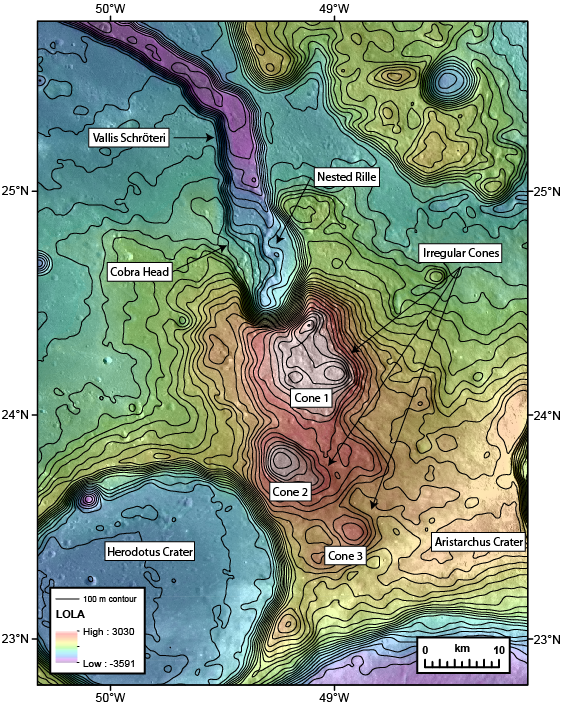
The Aristarchus plateau is widely agreed to be the most complex volcanic region on the Moon: the plateau contains both the largest pyroclastic deposit and the widest and deepest sinuous rille, and is surrounded by some of the Moon's youngest mare basalts. While the complex stratigraphy and diversity of volcanic features in the region may have formed through smaller eruptions spread across the plateau, evidence of large irregular cone-like features just south of Cobra Head suggest that several of the major volcanic features could have erupted from single volcanic vent. The morphology and physical characteristics of these irregular cone-like features could explain the spatial proximity of the pyroclastic deposit and sinuous rille. This emplacement model is currently being tested by assessing the regional morphologic and morphometric properties of the plateau, as well as performing spectral modeling of Moon Mineralogy Mapper (M3) data of the pyroclastic deposit. For more information see this LPSC abstract about the eruption model and this one about spectral modeling.
The Aristarchus plateau represents one of the most promising future exploration destinations on the Moon. The large pyroclastic deposit may have a high concentration of trapped volatiles, which is scientifically critical to understand the lunar volatile inventory and also provides abundant opportunity for in situ resource utilization (ISRU). In addition, the geologic diversity of the plateau allows access to sites of diverse volcanism (explosive/effusive; mafic/silicic), as well as a fresh, well-preserved impact structure in Aristarchus crater.
This site is included in the list of high-priority landing sites in our 2018 publication of findings from the Lunar Science for Landed Missions Workshop. Co-authors: Sarah N. Valencia, Ryan N. Watkins, James M. Crowell, Clive R. Neal, Gregory Schmidt
Past Research
Examining spectral variations of localized lunar pyroclastic deposits
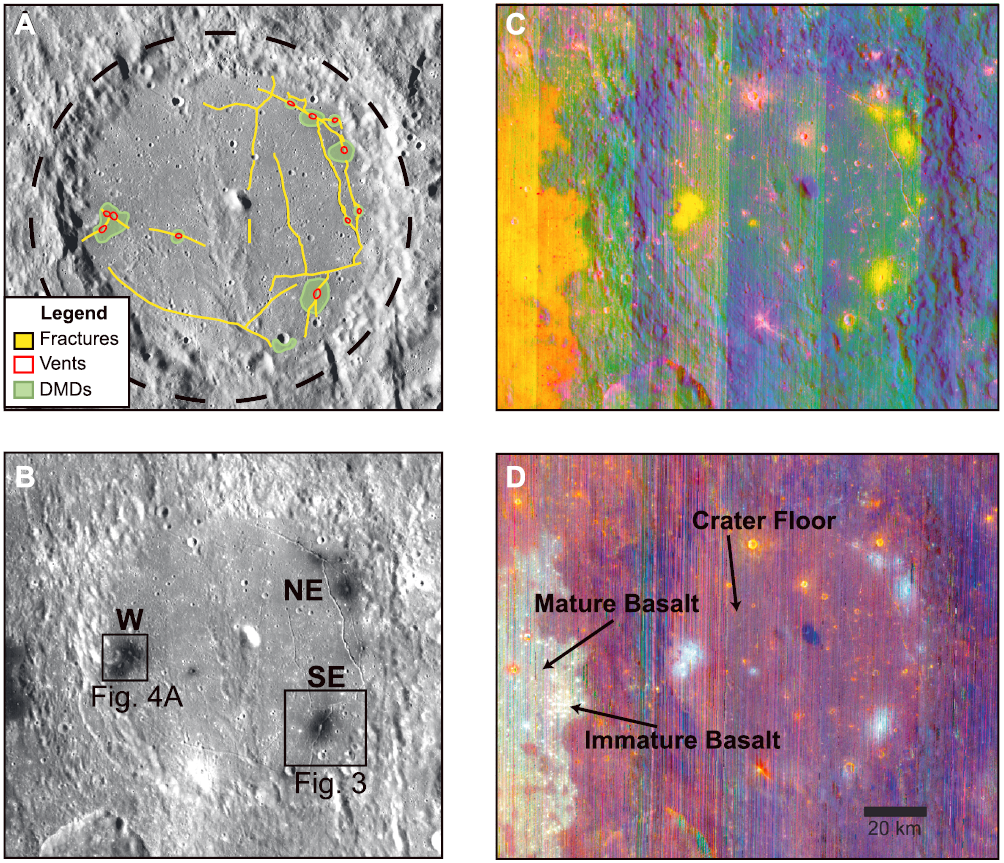
Alphonsus crater. (A) Sketch map with a Kaguya TC evening mosaic as the basemap. (B) M3 1 μm albedo map. DMDs appear dark, and specific subdeposits studied here are labeled. (C) RGB color composite image using R: IBD 1000 nm, G: BD 1900 nm, and B: R 1580 nm. (D) RGB color composite image using R: BD 950 nm, G: BD 1050 nm, and B: BD 1250 nm. Spectra of mare basalts and crater floor used in right image (D) are identified here.
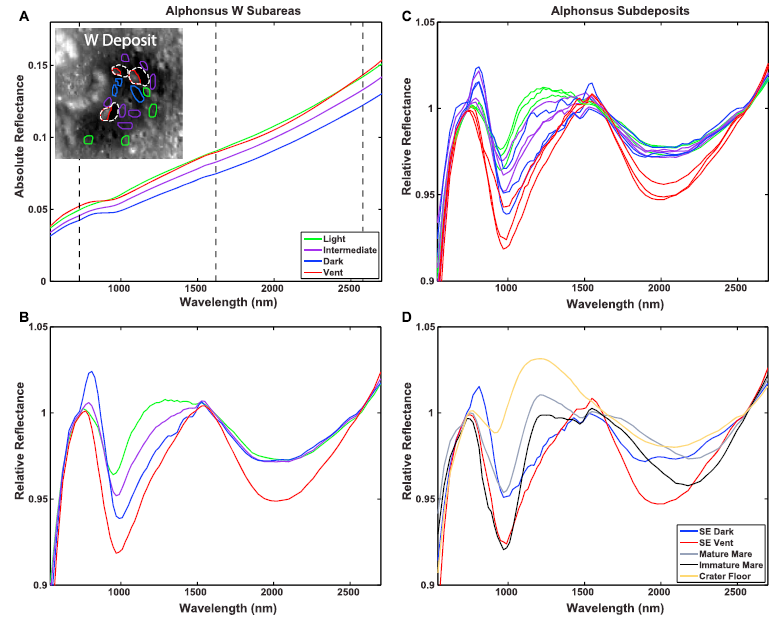
Spectra of Alphonsus crater DMDs. (A) Absolute reflectance. Black dashed lines indicate the endpoints used to calculate the continuum. Inset image shows the study areas of each spectral unit (i.e., light, intermediate, dark, and vent) in the western subdeposit. Outline colors correspond to the colors in the spectra. White dashed lines are the approximate outline of the volcanic vents, while the spectral regions outlined in red are the portions used in the analysis. (B) Spectra from (A) with continuum removal applied. (C) The continuum-removed spectra of the W, SE, and NE subdeposits in Alphonsus crater. The colors for the spectra are maintained from (A) and (B). (D) Continuum-removed spectra of SE deposit, as well as spectra from the floor of Alphonsus crater and two basalts from eastern Mare Nubium; see left image (D).
The localized lunar dark mantle deposits (DMDs) in Alphonsus, J. Herschel, and Oppenheimer craters were analyzed using visible-near-infrared spectroscopy data from the Moon Mineralogy Mapper (M3). Spectra of these localized DMDs were analyzed for compositional and mineralogical variations within the deposits and were compared with nearby mare basalt units. Spectra of the three localized DMDs exhibited mafic absorption features indicating iron-rich compositions, although the DMDs were spectrally distinct from nearby mare basalts. All of the DMDs contained spectral signatures of glassy materials, suggesting the presence of volcanic glass in varying concentrations across the individual deposits. In addition, the albedo and spectral signatures were variable within the Alphonsus and Oppenheimer crater DMDs, suggesting variable deposit thickness and/or variations in the amount of mixing with the local substrate. Two previously unidentified localized DMDs were discovered to the northeast of Oppenheimer crater. The identification of high concentrations of volcanic glass in multiple localized DMDs in different locations suggests that the distribution of volcanic glass across the lunar surface is much more widespread than has been previously documented. The presence of volcanic glass implies an explosive, vulcanian eruption style for localized DMDs, as this allows volcanic glass to rapidly quench, inhibiting crystallization, compared to the larger hawaiian-style eruptions typical of regional DMD emplacement where black beads indicate a higher degree of crystallization. Improved understanding of the local and global distributions of volcanic glass in lunar DMDs will further constrain lunar degassing and compositional evolution throughout lunar volcanic history.
Check out full version of the 2015 paper here.
Co-authors on this work: Sebastien Besse, Lisa R. Gaddis, Jessica M. Sunshine, James W. Head, and Sara Mazrouei
The relationship between radar scattering and surface roughness of lunar volcanic features

(Left) Relationships between surface roughness measured using various techniques, including P- and S-band radar circular polarization ratio (CPR) data, and LOLA-derived Topographic Planar Offset (TPO), for a variety of lunar geologic targets, primarily including volcanic features.
(Right) LOLA hillshade map of the four volcanic dome units analyzed in this work., among other volcanic features

Lunar roughness measurements derived from the Lunar Orbiter Laser Altimeter (LOLA) are compared to 12.6 cm wavelength radar data (S-band) collected by the Miniature Radio Frequency instrument and 70 cm wavelength radar data (P-band) collected by the Arecibo Observatory. These data are compared to assess how surface and subsurface roughness are correlated and affected by parameters including age and composition at length scales between 0.1-100 m. A range of features are analyzed including volcanic domes (Marius Hills, Rümker Hills, Gruithuisen, and Mairan Domes); mare (Imbrium, Serenitatis, and Oceanus Procellarum); pyroclastic dark mantle deposits (Sinus Aestuum, Sulpicius Gallus, and Mare Vaporum); and two young craters (Copernicus and Tycho). Statistically significant positive correlations exist between topographic roughness and both P- and S-band circular polarization ratios. The strongest correlation is observed at the longest length scales. Correlations weaken as length scales become less similar, potentially due to distinct processes controlling surface modification. Roughness is not significantly correlated with local slope. Although the Marius Hills are compositionally distinct from the Gruithuisen and Mairan domes, they are indistinguishable in roughness characteristics. Conversely, the Rümker Hills, mare, and dark mantle deposits are smoother at the length scales examined, possibly due to fine-grained mantling of regolith or pyroclastic deposits. The floor and ejecta of Tycho crater are the roughest surfaces measured in this study, while the floor and ejecta of Copernicus crater overlap the roughness distribution of the volcanic features. This study shows that many factors control the evolution of roughness over time on various length scales.
Check out the full version of the 2014 paper here.
Co-authors on this work: Walter S. Kiefer, Caleb I. Fassett, D. Benjamin J. Bussey, Joshua T. S. Cahill, M. Darby Dyar, Samuel J. Lawrence, and Paul D. Spudis